GfK forecasts a 2016 per-capita purchasing power of €42,300 for Switzerland. According to the GfK study, the total purchasing power for Switzerland in 2016 is €348.5bn (excluding Liechtenstein), while the total 2016 purchasing power for Austria is approximately €193.5bn. The latter figure corresponds to an average of €22,536 available to each Austrian for consumption, rent and living costs.
Purchasing power measures the available net income of the population, including government subsidies such as unemployment assistance, child benefit and pension contributions. GfK's study illuminates the regional differences in these values, revealing the regional distribution of purchasing power within and between each individual country.
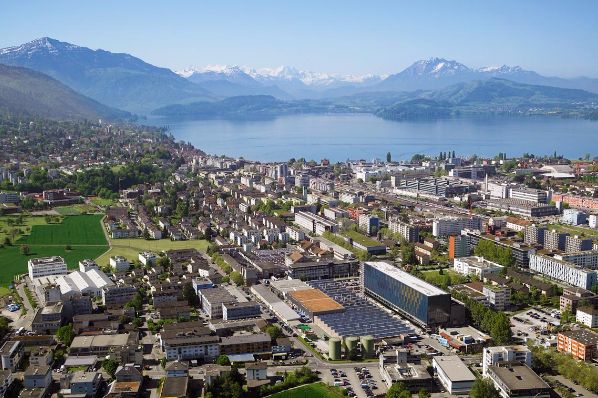
Switzerland
Comparison of cantons
Inhabitants of Zug – Switzerland's most affluent canton – have 1.5 times the purchasing power of the national average. Inhabitants of the second- and third-ranked cantons, Schwyz and Nidwalden, have purchasing power levels that exceed the Swiss average by approximately 36% and 22%, respectively. Only seven of the 26 cantons have an above-average per-capita purchasing power, which shows that even in affluent Switzerland, there are significant regional differences in purchasing power.
Switzerland: Top 10 cantons in 2016
|
rank |
canton |
inhabitants |
per-capita purchasing power in € |
per-capita purchasing power index* |
|
1 |
Zug |
120,089 |
64,990 |
153.6 |
|
2 |
Schwyz |
152,759 |
57,023 |
134.8 |
|
3 |
Nidwalden |
42,080 |
51,579 |
121.9 |
|
4 |
Zürich |
1,446,354 |
47,824 |
113.1 |
|
5 |
Geneva |
477,385 |
47,465 |
112.2 |
|
6 |
Basel-Landschaft |
281,301 |
44,341 |
104.8 |
|
7 |
Basel-Stadt |
190,580 |
43,880 |
103.7 |
|
8 |
Vaud |
759,354 |
42,070 |
99.5 |
|
9 |
Aargau |
645,277 |
41,160 |
97.3 |
|
10 |
Solothurn |
263,719 |
40,894 |
96.7 |
source: GfK Purchasing Power Switzerland 2016 * index per inhabitant; 100 = national average
The three least wealthy cantons – Glarus, Uri and Jura – have purchasing power levels between 13% and 19% below the Swiss average. Even so, inhabitants of the least affluent canton Jura still have €34,095 per person, which is significantly more than inhabitants of Starnberg, Germany's district with the lowest purchasing power (€31,850). But Swiss inhabitants must also pay substantially more for accommodation and food.
Districts
There is a wide distribution of purchasing power values at the district level in Switzerland's cantons. In Schwyz – Switzerland's second-most affluent canton – each inhabitant has an average of €57,023. But regional differences are apparent within this canton upon close inspection.
For example, inhabitants of the district of Gersau have around five % more purchasing power than the Swiss average. But this means these inhabitants have around 30 % less purchasing power than the canton average. Inhabitants of the district of Küssnacht have on average 45% more income than the Swiss average, and the average purchasing power in the district of Höfe is more than twice as high as the national average.
The purchasing power gap is smaller in canton St Gallen, whose inhabitants have an average purchasing power of €36,905. Inhabitants of the constituency See-Gaster am Obersee have an average purchasing power of €39,130, while inhabitants of the constituency Toggenburg have only €32,731, which is 10% below the canton average.
Switzerland: Top 10 districts
|
rank |
district |
inhabitants |
per-capita purchasing power in € |
per-capita purchasing power index* |
|
1 |
Höfe district |
28,028 |
94,073 |
222.4 |
|
2 |
Meilen district |
99,946 |
65,825 |
155.6 |
|
3 |
Zug canton |
120,089 |
64,990 |
153.6 |
|
4 |
Küssnacht (SZ) district |
12,395 |
60,650 |
143.4 |
|
5 |
Horgen district |
121,220 |
52,978 |
125.2 |
|
6 |
March district |
41,575 |
52,156 |
123.3 |
|
7 |
Nidwalden canton |
42,080 |
51,579 |
121.9 |
|
8 |
Nyon district |
95,548 |
51,137 |
120.9 |
|
9 |
Lavaux-Oron district |
58,624 |
50,058 |
118.3 |
|
10 |
Uster district |
126,004 |
48,182 |
113.9 |
source: GfK Purchasing Power Switzerland 2016 * index per inhabitant; 100 = national average
Austria
Lower Austria is the only federal state whose purchasing power is significantly above (around 4%) the Austrian average. Vorarlberg is ranked second, closely followed by Austria, Salzburg and Vienna, all of which are just above the national average. The other federal states have below-average purchasing power.
A consideration of the purchasing power per household yields some interesting insights. Lower Austria leads again in this regard with values that exceed the national average by 8%. Vorarlberg has a household purchasing power around 7% above the average, followed by Burgenland.
Vienna has the lowest purchasing power per household at around 10% below the national average. This is indicative of a higher number of single-person households in Austria's capital; in households with just a single earner, the average purchasing power per household is correspondingly lower.
2016 purchasing power in Austria's federal states
|
rank |
federal state |
inhabitants |
purchasing power index per inhabitant* |
purchasing power index per household* |
|
1 |
Lower Austria |
1,636,778 |
104.4 |
107.8 |
|
2 |
Vorarlberg |
378,592 |
101.2 |
106.5 |
|
3 |
Upper Austria |
1,437,251 |
100.5 |
104.4 |
|
4 |
Salzburg |
538,575 |
100.3 |
103.1 |
|
5 |
Vienna |
1,797,337 |
100.3 |
90.4 |
|
6 |
Burgenland |
288,356 |
99.0 |
104.6 |
|
7 |
Carinthia |
557,641 |
96.9 |
96.6 |
|
8 |
Styria |
1,221,570 |
96.9 |
98.7 |
|
9 |
Tyrol |
728,826 |
95.5 |
98.6 |
source: GfK Purchasing Power Austria 2016 * index per inhabitant/household; 100 = national average
Districts
More than half of Austria's ten districts with the most purchasing power are in Vienna. Vienna's domination of the purchasing power rankings for Austria's districts is due not only to the area's genuinely higher purchasing power, but also to the granular subdivision of Vienna into 23 districts.
The district Wien 1 – Innere Stadt has a per-capita purchasing power of €40,217, which is 79% higher than the Austrian average. Second place is occupied by Vienna's thirteenth district, Hietzing, which has around one-fourth less purchasing power. This district has a per-capita purchasing power of approximately €30,576, which is around 36% above the national average. With €29,101 available per person, inhabitants of third-ranked Mödling in Lower Austria have around 29% more purchasing power than the national average. The city district of Eisenstadt is ranked tenth with a per-capita purchasing power around 16% higher than the national average.
Compared to the previous year, the discrepancy in the purchasing power between city districts and their surrounding areas has decreased in some instances. This is the case for Linz and Linz-Land, Klagenfurt and Klagenfurt-Land, Sankt Pölten and Sankt Pölten-Land as well as Eisenstadt and Eisenstadt-Umgebung.
About GfK
GfK is the trusted source of relevant market and consumer information that enables its clients to make smarter decisions. More than 13,000 market research experts combine their passion with GfK’s long-standing data science experience. This allows GfK to deliver vital global insights matched with local market intelligence from more than 100 countries. By using innovative technologies and data sciences, GfK turns big data into smart data, enabling its clients to improve their competitive edge and enrich consumers' experiences and choices.