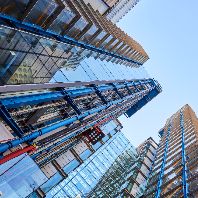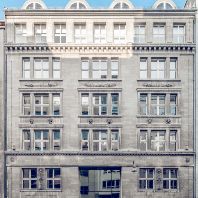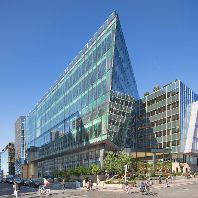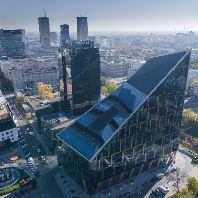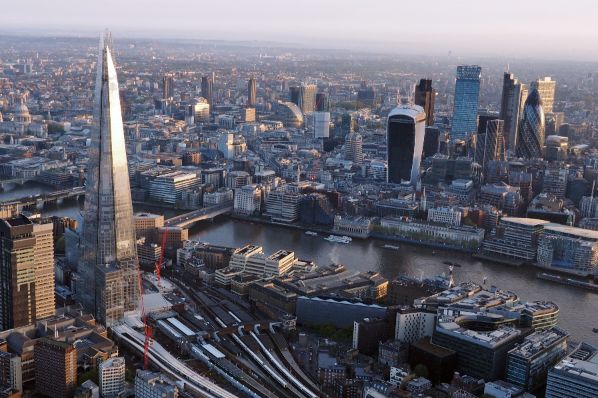
The only international study that assesses and compares 21 leading Global Business Districts (GBDs) has confirmed that business districts in Western Europe and North America continue to lead the way, amid fierce competition from Asian business districts, but all will need to adapt in response to the Covid-19 crisis. According to the 2020 Attractiveness of Global Business Districts Report, published by EY and the Urban Land Institute (ULI), and commissioned by the GBD Innovation Club, the City of London takes the top position in the GBD rankings with New York’s Midtown, Tokyo’s Marunouchi, and Paris’ La Défense close behind. The report highlights how competition between business districts is intensifying with the range of the EY-ULI Index scores – a ranking established as part of a previous report – narrowing between the 21 GBDs since 2017. The largest increases in the EY-ULI Index between 2017 and 2020 were by Asian business districts, with Beijing’s Central Business District leading the charge.
“The 2020 Attractiveness of Global Business Districts Report highlights how the ability to attract talent has become even more important when assessing the attractiveness of business districts in comparison to the 2017 edition”, said Lisette van Doorn, CEO of ULI Europe. “Key elements to attract talent include quality of life, health and wellbeing and the availability of a live/work/play environment. Post Covid-19, we expect these human elements to become even more important than they already are. Business districts will have to adjust to a ‘new normal’ and those that do most successfully are expected to rise up the rankings in the future.”
“Among the big questions for business districts will be whether they are able to convince all their stakeholders that they are still special and unique places to operate,” said Marc Lhermitte, partner at Ernst & Young Advisory, France. “Before the outbreak of Covid-19, global business districts were in a high-stakes race to attract talent, new business and capital. For the most part, this will continue, albeit under new rules and those markets that can adapt to a post-pandemic world will be best-placed to succeed. In particular, business districts users will look for optimised, safer and more attractive workplaces.”
“There is no doubt that Global Business Districts will need to adapt to the ‘new normal’ but the Covid-19 crisis has made clear that human beings need social interaction and thrive from it,” said Marie-Célie Guillaume, Chairwoman of the Global Business Districts Innovation Club and CEO of Paris La Défense. “We are confident that the core of a GBD’s attractiveness formula will remain the same. International businesses – which represent the vast majority of GBDs – will need to resume staff meetings, conduct strategic projects, host clients and business partners.”
Five key observations are made by the report authors, including that:
- The concentration of talent, unparalleled business efficiency, and instant connectivity are fundamental strengths of GBDs.
- Prioritising the environment is an obligation to attract talent and tenants.
- Changing working patterns and focus on wellbeing might put pressure on the economic outlook of GBDs.
- Global risks facing cities and GBDs call for collective resilience strategies and collaboration between stakeholders.
- In the long term, GBDs must become inclusive urban destinations, beyond concentrations of office space.
The EY-ULI Index ranked the leading 21 GBDs in terms of attractiveness:
|
Ranking |
Business District |
EY-ULI Index |
Previous 2017 ranking |
Previous 2017 EY-ULI Index |
|
1 |
London, The City |
58.9 |
1 |
61.5 |
|
2 |
New York, Midtown |
57.5 |
2 |
58.7 |
|
3 |
Tokyo, Marunouchi |
54.7 |
3 |
52.1 |
|
4 |
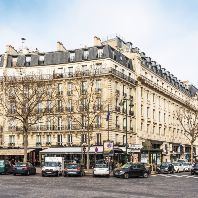
Paris, La Défense |
52.0 |
4 |
50.5 |
|
5 |
London, Canary Wharf |
51.5 |
5 |
49.6 |
|
6 |
New York, Financial District |
48.5 |
6 |
48.2 |
|
7 |
Beijing, CBD |
45.8 |
9 |
41.1 |
|
8 |
Seoul, Gangnam |
45.6 |
N/A |
N/A |
|
9 |
Singapore, Downtown Core |
45.6 |
8 |
45.7 |
|
10 |
Chicago, The Loop |
45.6 |
7 |
46.4 |
|
11 |
Toronto, Financial District |
43.2 |
N/A |
N/A |
|
12 |
San Francisco, Financial District |
42.6 |
N/A |
N/A |
|
13 |
Hong Kong, Central District |
40.4 |
11 |
36.6 |
|
14 |
Sydney, CBD |
40.1 |
N/A |
N/A |
|
15 |
Amsterdam, Zuidas |
38.1 |
12 |
36.6 |
|
16 |
Frankfurt, Bankenviertel |
35.8 |
10 |
37.3 |
|
17 |
Dubai, DIFC |
35.5 |
13 |
34.0 |
|
18 |
Shanghai, Pudong-Lujiazul |
35.0 |
14 |
32.3 |
|
19 |
Sao Paulo, Paulista Avenue |
14.8 |
15 |
20.2 |
|
20 |
Johannesburg, Sandton |
13.3 |
16 |
16.9 |
|
21 |
Mumbai, Bandra Kurla Complex |
9.4 |
17 |
6.0 |