
With all of the information on commercial real estate (CRE) transactions in and processed there is time to reflect on some interesting changes to capital flows into Europe.
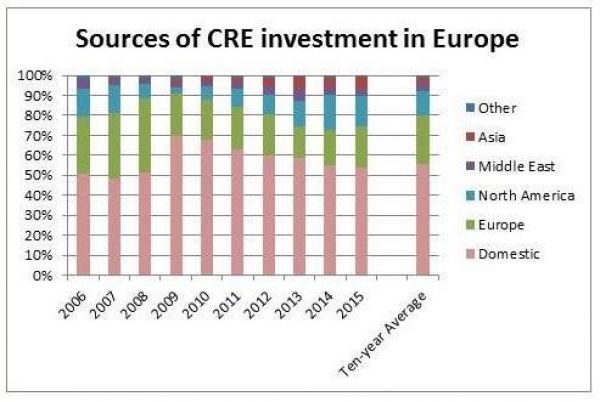
2015 was a record year, with nearly €273bn spent on European CRE and despite the fact that most of the headline grabbing deals were done by international capital (37 of the 50 biggest transactions), the majority of capital still comes from local investors. The proportion has been falling away over the last six years. At the height of the financial crisis local buyers were 70% of the European market. Last year that had fallen to 54%.
The growth in cross-border investment is mainly coming from outside Europe. Cross-border investment within Europe has been remarkably steady at around 20% of total turnover since 2009; however, where it has been coming from has changed markedly.
In 2009 German investors (particularly the Open-ended and Special Funds) dominated intra-European investment flows. More recently it has been UK-based funds that have made the biggest contribution, although capital from France has also been much more prominent. In between (2011-2013), when NBIM were most active, Norwegian investors were accounting for over 10% of intra-European investment.
The recent prominence of the UK at the top of the list of cross-border investors within Europe is highly dependent on its status as a centre for fund management. As a result, not all of the capital involved will have originated in the UK. The trend over the last couple of years for real estate investors to move up the risk curve in search of yield and growing interest in value-add has favoured indirect investment for cross-border investors looking for more local capabilities and understanding.
When we look at the flows into European CRE from outside the region there are two stand-out results; the persistently high level of North American capital and the rapid growth in investment from Asia.
The growth in investment flows from Asia is spectacular. In 2008 we recorded only €600m of investment in European CRE by Asian buyers, just 0.5% of market turnover. In 2015 the total was nearly €16bn, representing 5.8% of the total European market.
The sources of this investment have changed over time. In 2009/10 South Korea was the main source of Asian capital into Europe. Malaysia was the biggest single source in 2011/12. Most recently it has been China, with €3bn spent on European CRE in 2014 and €3.4bn in 2015, although Singapore and Taiwan have also become more important sources of investment too.
North American investors spent over €40bn on European CRE in both 2014 and 2015 and have consistently. As with the UK, the apparent capital flows from North America (and especially those from the US) depend to a great extent on the fund managers based there and not all of the capital will have originated there.
Looking ahead, a noticeable change in the second half of 2015 was the falling away of investment into Europe from the U.S., mainly in the UK. Both in absolute terms and as a percentage of market turnover this peaked in Q4 2014 at €15.8bn (20% of the market) and in Q4 2015 investment from the US had fallen to €9.3bn (11%).
US capital is, on average, higher risk than most other cross-regional investment and this perhaps reflects their perception that the ‘low-hanging fruit’ in terms of opportunistic returns in European investment has already been picked.
This article was written by Michael Haddock, Senior Director, EMEA Research, CBRE, for the CBRE Capital Watch blog.